Part 3: What about buying clinics rather than opening new ones?
Considerations and financial projections of the roll-up strategy
After examining organic growth in Part 2, we’re wrapping up Season 3 by looking at the flip side of the coin – inorganic growth (a.k.a. roll-ups). Altogether, I hope Season 3 provides a holistic perspective on the complexities, returns potential, and trade-offs of different revenue growth strategies of healthcare service businesses.
Healthcare service roll-up basics
At a basic level, healthcare service roll-ups involve acquiring multiple, smaller healthcare services businesses in the same segment and/or geographic region and combining them into a larger, more efficient entity. In theory, since the entity is larger, value is created from economies of scale and operational synergies (via higher prices, lower costs, etc.) or higher purchase price multiples at exit (i.e., versus at entry).
Compared to opening new clinics, roll-up strategies can accelerate growth as well as the realization of scale-related benefits. By buying established businesses, roll-ups don’t face “starting from scratch” risks such as generating demand or hiring staff like the organic growth strategy does (as highlighted in Part 2).
Quick callouts
As in Part 2, we’ll start with the same illustrative PT business with 2 clinics and $300K total EBITDA. Roll-ups oftentimes have a larger initial acquisition with smaller subsequent “tuck-in” acquisitions, but for this exercise, we’ll be tucking in clinics equal in size to the initial acquisition (i.e., $150K EBITDA each).
Ideally, we’d roll-up clinics until reaching $5M EBITDA as reaching this threshold garners greater interest from lower-middle market private firms as potential buyers. However, if each PT clinic generates $150K EBITDA, that means we’d need to acquire 33 clinics. These clinics need to be partially cash-pay, need comparable margins, need to pass due diligence, need an owner willing to sell, and need investors and lenders willing to finance acquisitions. These dynamics illustrate the how hard it is to find the “right” businesses to buy, and this is a challenge core to roll-up strategies.
For the exercise’s sake, we’ll say 33 is unrealistic and instead seek to acquire 20 clinics (i.e., roughly one-third of 33) over five years as outlined in Chart 1. Being more acquisitive in later years allows you to increase cash reserves, build a repeatable playbook for sourcing, financing, and integrating new clinics, and strengthen credibility with your investors and/or lenders.
Chart 1: Proposed acquisition schedule
Securing financing for acquisitions
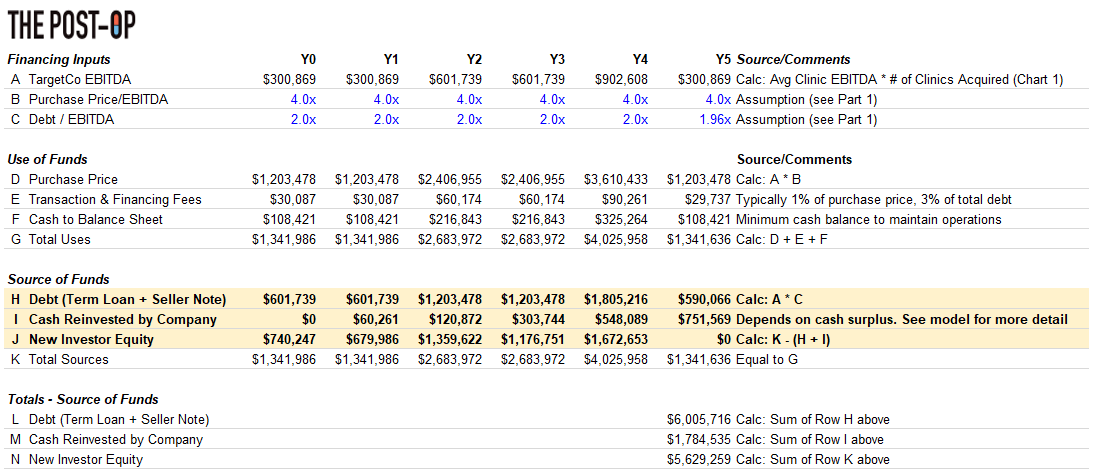
Another major difference between buying versus open clinics is the need for ongoing financing to execute acquisitions. Part 2 illustrated how organic growth can/should be financed with cash generated by the business. In roll-ups, cash flows can be reinvested into acquisitions (at the expense of investing in other parts of the business), but an acquisition-minded entrepreneur will still need investors and lenders to provide additional equity and debt to finance ongoing acquisitions.
Chart 2 estimates the equity and debt required to acquire 20 clinics over 5 years – in total, $6M and $5M from lenders and investors, respectively (Rows L & N). We’re assuming we can secure this financing; however, the reality is investors and lenders’ top priority is getting their money back, making roll-ups inherently riskier than organic growth in their eyes. Thus, financing roll-ups requires greater credibility than organic growth and a willingness of investors and lenders to form a strong, long-term relationship with the acquisition-minded entrepreneur. Perhaps performing a smaller-scale roll-up (like our example) makes it less complicated, but regardless, securing financing is easier said than done.
Chart 2: Financing by acquisition
Creating value – provider utilization, economies of scale, operational synergies
Provider utilization
Part 2 discussed how organic growth strategies should prioritize increasing provider utilization by generating more demand via strategic marketing or improving provider efficiency via reduced time spent on administrative tasks. These growth levers exist in roll-ups but shouldn’t be relied upon as any cash flow remaining after debt payment is better spent re-investing in acquisitions (i.e., to limit additional equity needed from investors).
However, as briefly discussed above, because of the newly combined entity’s size (20 clinics!), roll-ups, in theory, naturally benefit more from economies of scale and/or operational synergies than organic growth strategies. ‘Economies of scale’ and ‘operational scale’ are buzzy terms, but what do they really mean and what are they worth?
Economies of scale benefits
#1: Increasing prices
In addition to simply commanding higher reimbursement rates from being a larger entity overall, roll-ups also increase rates with payers as follows:
Find a geographic region with a non-monopolistic payer landscape
Acquire a large clinic that commands “favorable” rates with local payers
Acquire smaller clinics in same region with presumably worse rates
Integrate smaller clinics into large clinic (i.e., under same Tax Identification Number)
Bill services delivered at smaller clinics at the larger clinic’s higher rates
Cash-pay has its benefits, but the above tried-and-true method of increasing reimbursement rates is unfortunately not one of them. Nevertheless, ‘Rolled-Up Co’ probably should not assume major price increases for its cash-pay population since it could cause patient retention issues.
Thus, I’d say price increases are possible, but best to keep them conservative (i.e., slightly higher than inflation). Chart 3 shows the annual revenue lift from said modest price increases.
Chart 3: Single clinic annual revenue lift from price increases
#2: Decreasing supply costs
As more clinics are rolled-up, supplies needed for each visit can be purchased in increasingly greater bulk and at lower costs, thus reducing per-visit supply costs. As Chart 4 illustrates, supplies used per-visit in PT are already so limited that any supply cost reduction is unlikely to materially increase EBITDA.
Chart 4: Physical therapy per-visit supply costs
For example, infusion clinics have high per-visit supply costs (i.e., $7K per visit!) and thus are much more likely to capture this ‘buy in bulk’ benefit than a business such as physical therapy where per-visit supplies cost less than 50 cents.
Operational synergies benefits
#1: Decreasing sales and marketing spend
To decrease sales and marketing spend, all acquired clinics would likely need to be rolled up under one brand in a single geographic area. In that case, you could immediately decrease sales and marketing spend at each acquired clinic since the brand would already been known in that area. I don’t believe it’s reasonable to assume decreasing marketing spend is an operational synergy because: 1) it requires finding multiple cash-pay PT businesses in the same area (unlikely!) and 2) rolling up under one brand sacrifices the acquired businesses pre-existing local brands, which could make it harder to generate demand and could make the owner less likely to sell.
#2: Decreasing administrative costs
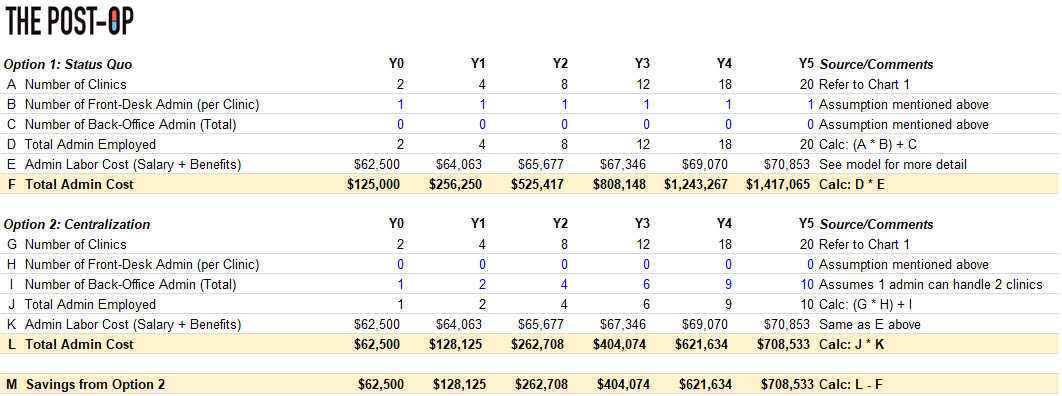
My working assumption is that, at the time of acquisition, each clinic will have 1 full-time employee (FTE) working at the front-desk and managing scheduling, billing, payroll, etc. As clinics are rolled-up, I see two options:
Status Quo: Maintain the 1 cross-trained FTE at the front desk of each clinic
Centralization: Save costs by remove FTE at the front desk altogether and perform scheduling, billing, payroll, etc. in a centralized back-office
Chart 5: Administrative cost options
Said differently, to truly capture administrative cost savings, the front desk admin at each clinic would need to be removed. This tactic would legitimately save costs (Row M) but would place a greater administrative burden on your PTs day-to-day and could change the clinic’s culture overall. Thus, I’m not sure Option 2 is worth it in practice, so Option 1 is what is included in the model.
Pulling it altogether – 5-year forecast and returns analysis
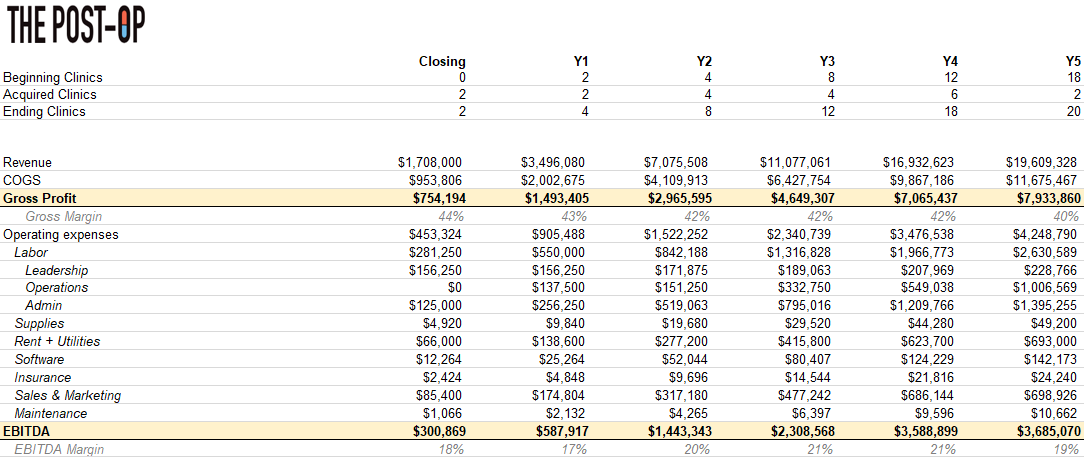
Zooming out, Rolled-Up Co marginally increased prices and didn’t capture much other scale benefits or synergies (indicated by EBITDA margin staying around 20%), but value was still created because Rolled-Up Co now generates $3.6M+ in EBITDA.
Chart 6: Consolidated revenue and EBITDA forecast
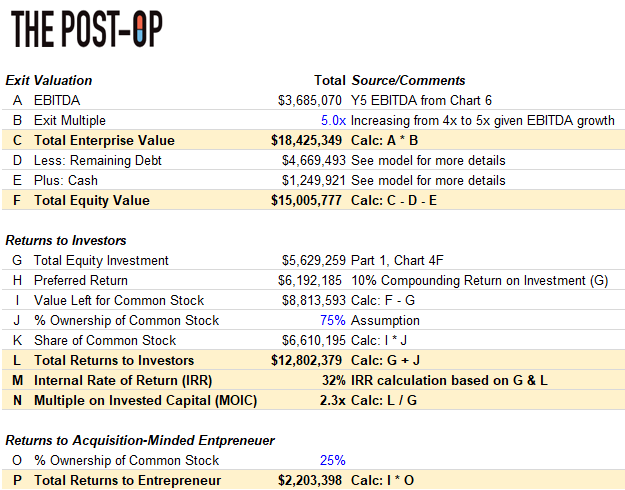
The original Purchase Price multiple was 4x (Part 1, Chart 4), but we can reasonably assume Rolled-Up Co could sell in Y5 at a 5x Purchase Price multiple as businesses of this size (i.e., $3.5M+) command higher multiples than 4x. After paying lenders and investors, selling the business at 5x would pocket the entrepreneur $2.2M.
Chart 7: Investor and acquisition-minded entrepreneur returns
How?! Without debt (so if Debt / EBITDA from Chart 2C was 0.0x and thus financing was solely equity from investors and the company), the roll-up strategy would generate a 23% return. We’ve assumed our blended interest rate on debt (i.e., term loan and seller note) is 14%, so our leveraged-return materially increases up to 32% (Row M) because we’ve effectively paid 14% interest to generate a 24% return!
Building (organic growth) vs. buying (roll-ups)
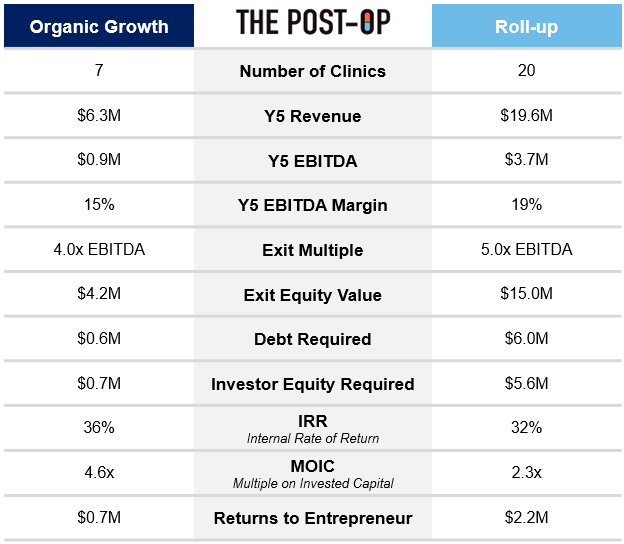
To close, below is summary of the two strategies with accompanying key financial metrics.
Chart 8: Organic growth vs. roll-ups comparison
Obviously, the roll-up return profile for the entrepreneur should make you wonder why anyone would execute an organic growth strategy after a buying an illustrative PT business like the one we did. In my opinion, there’s plenty of reasons why organic growth is still worth considering:
Less Capital Intensive: Compared to organic growth, roll-ups require significantly more debt, which is risky in general (since the business needs to continue to perform well enough to pay it down) and has become more expensive as interest rates have risen.
No Deal Sourcing: As mentioned, a huge assumption of a roll-up strategy is that the entrepreneur can find businesses with solid financial profiles with sellers willing to sell. Finding 20 “needles in the haystack” is far from guaranteed.
Less Competition: Even if you did find 20 needles in the haystack for the roll-up, there’s a decent chance you’ll have to bid against PE firms doing their own roll-ups and willing to pay much higher multiples than 4x to acquire the businesses.
Quality Control: This article focused on profits, but we’re still in the business of delivering quality care to patients. Naturally, the bigger you get, the harder it becomes to maintain quality standards and the greater the risk that quality begins to slip.
Other benefits of the organic growth strategy include that it is easier to secure financing (as discussed above), allows clinics to maintain culture and autonomy (rather than integrating with other clinics) and provides greater flexibility to make changes given the limited scale.
Parting shot
The reality is that projections for any acquisition and growth strategy are always assumption-driven and may very easily change based on factors like the size and financial position of the business acquired, outlook on the market, the buyer’s strategic priorities, and more.
So yes, not every takeaway from Season 3 will hold true for every single healthcare service buyout. However, and largely because no one has tackled this topic tactically, that was a sacrifice I was willing to make to demystify (via analyses grounded in strategic thinking and practicality) the terms we hear thrown around when PE or an acquisition-minded entrepreneur buys a healthcare service business.
**
Links to: Analysis (Excel) | Graphics (PPT)
If this topic interests you in any capacity (investor, entrepreneur, etc.), please feel free to reach out on to me on Twitter @z_miller4 or connect with me on LinkedIn here!


